Debugging is a major part of software development. Not only do you create new modules, but you must also maintain older ones. Some jobs are more focused on new software Greenfield project. Others may walk into a mature product and the job is to keep the status quo.
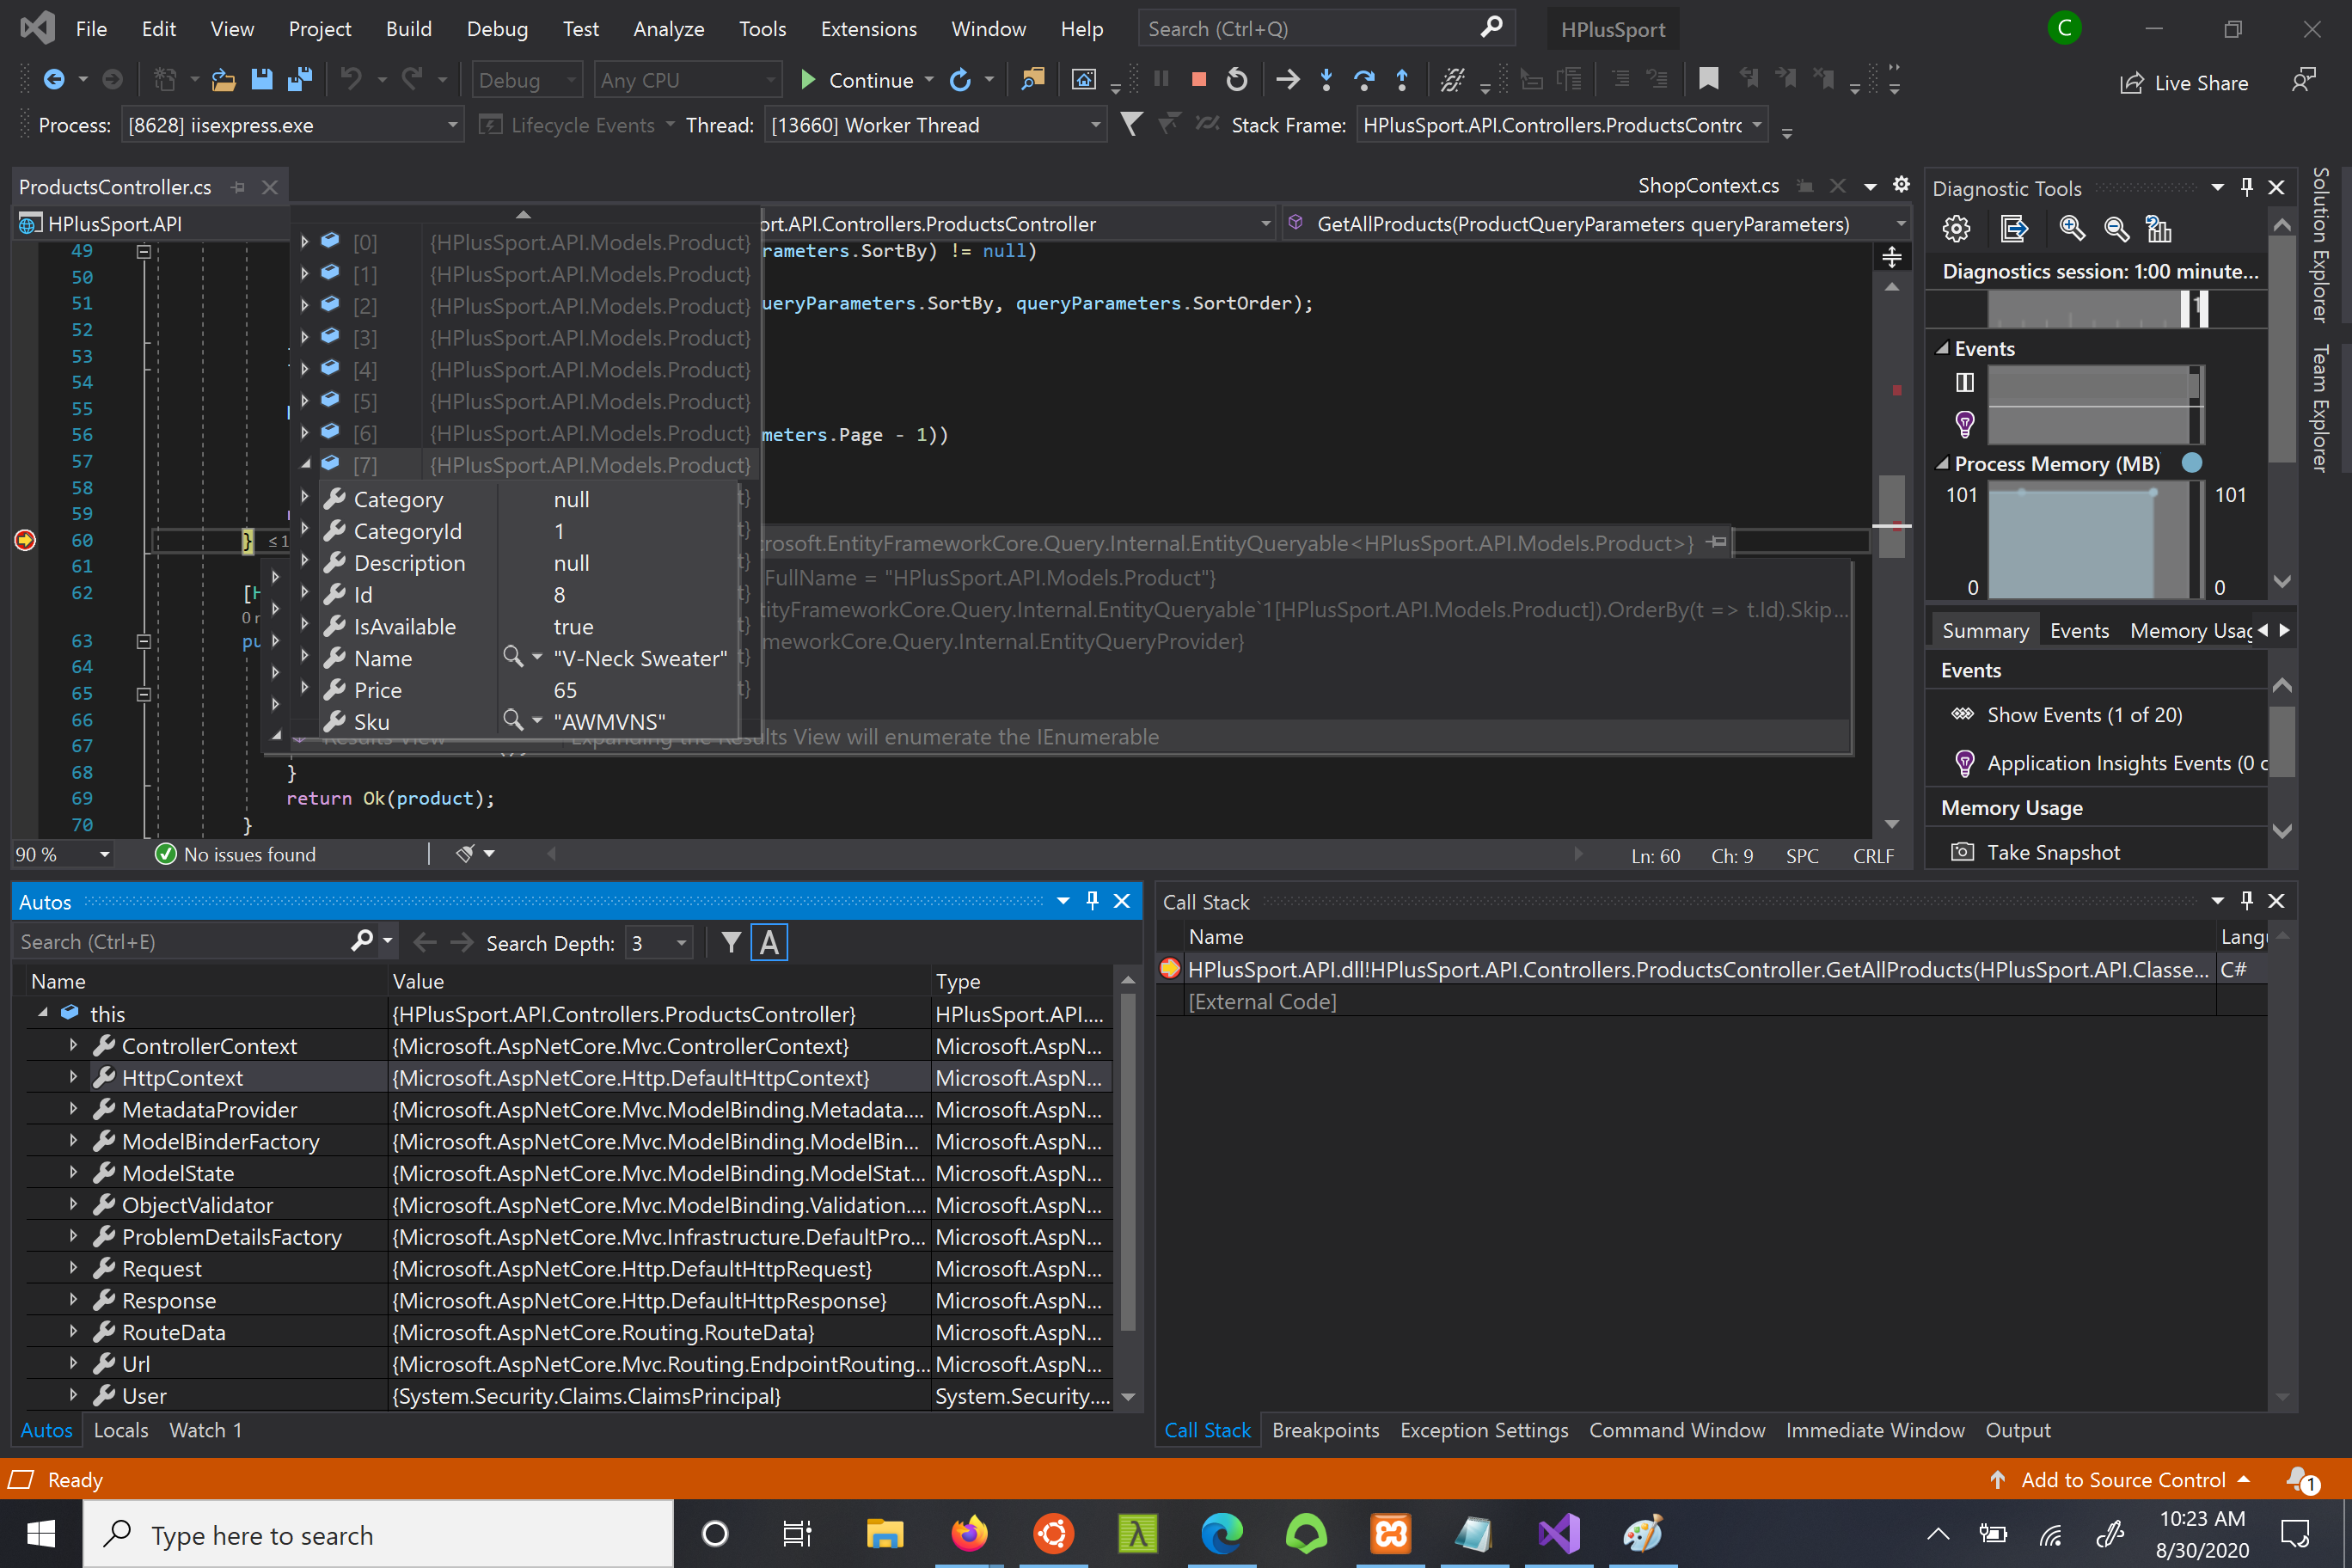
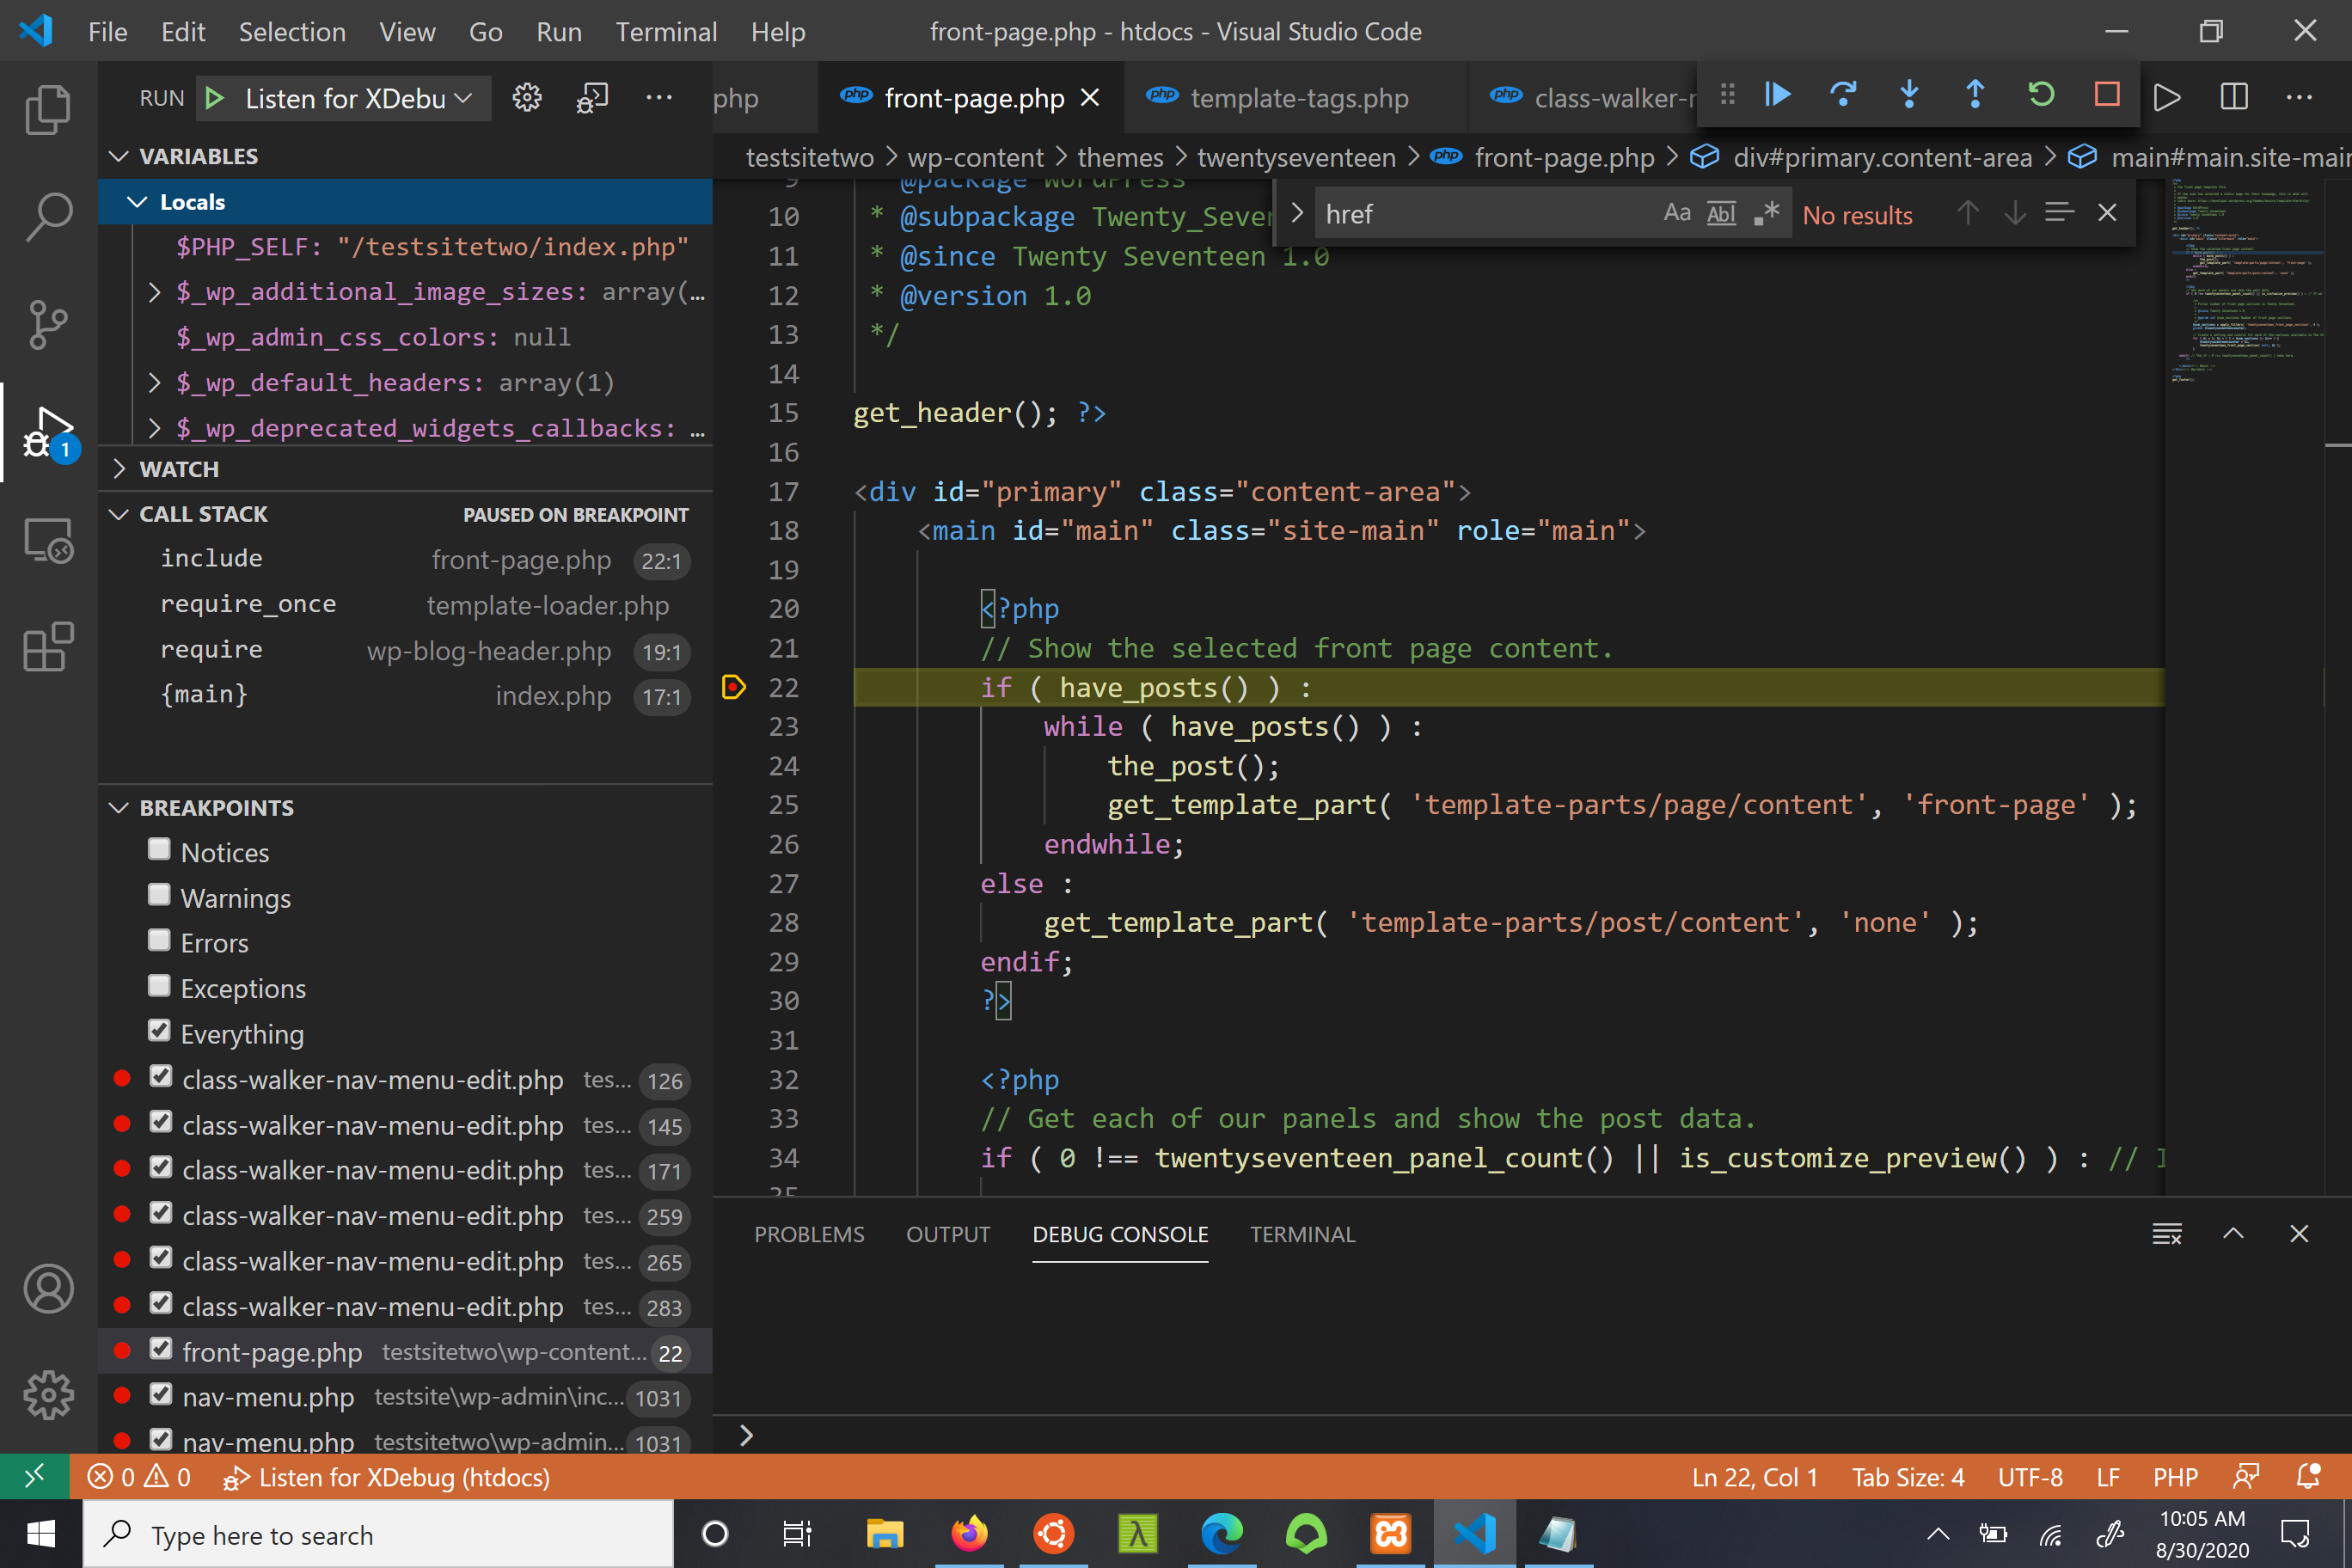
So jumping right into it breakpoints and walking through programs are a lifesaver. Breakpoints are one of the best tools in your box. Seeing the object’s data at a certain place or time can solve a lot of problems. Sometimes what you expect to get passed in is passed incorrectly. Or something is updating your object after you expect it to be modified. Other times you may have to walk through the code and just see what happens at each section before you place a breakpoint for easy access.

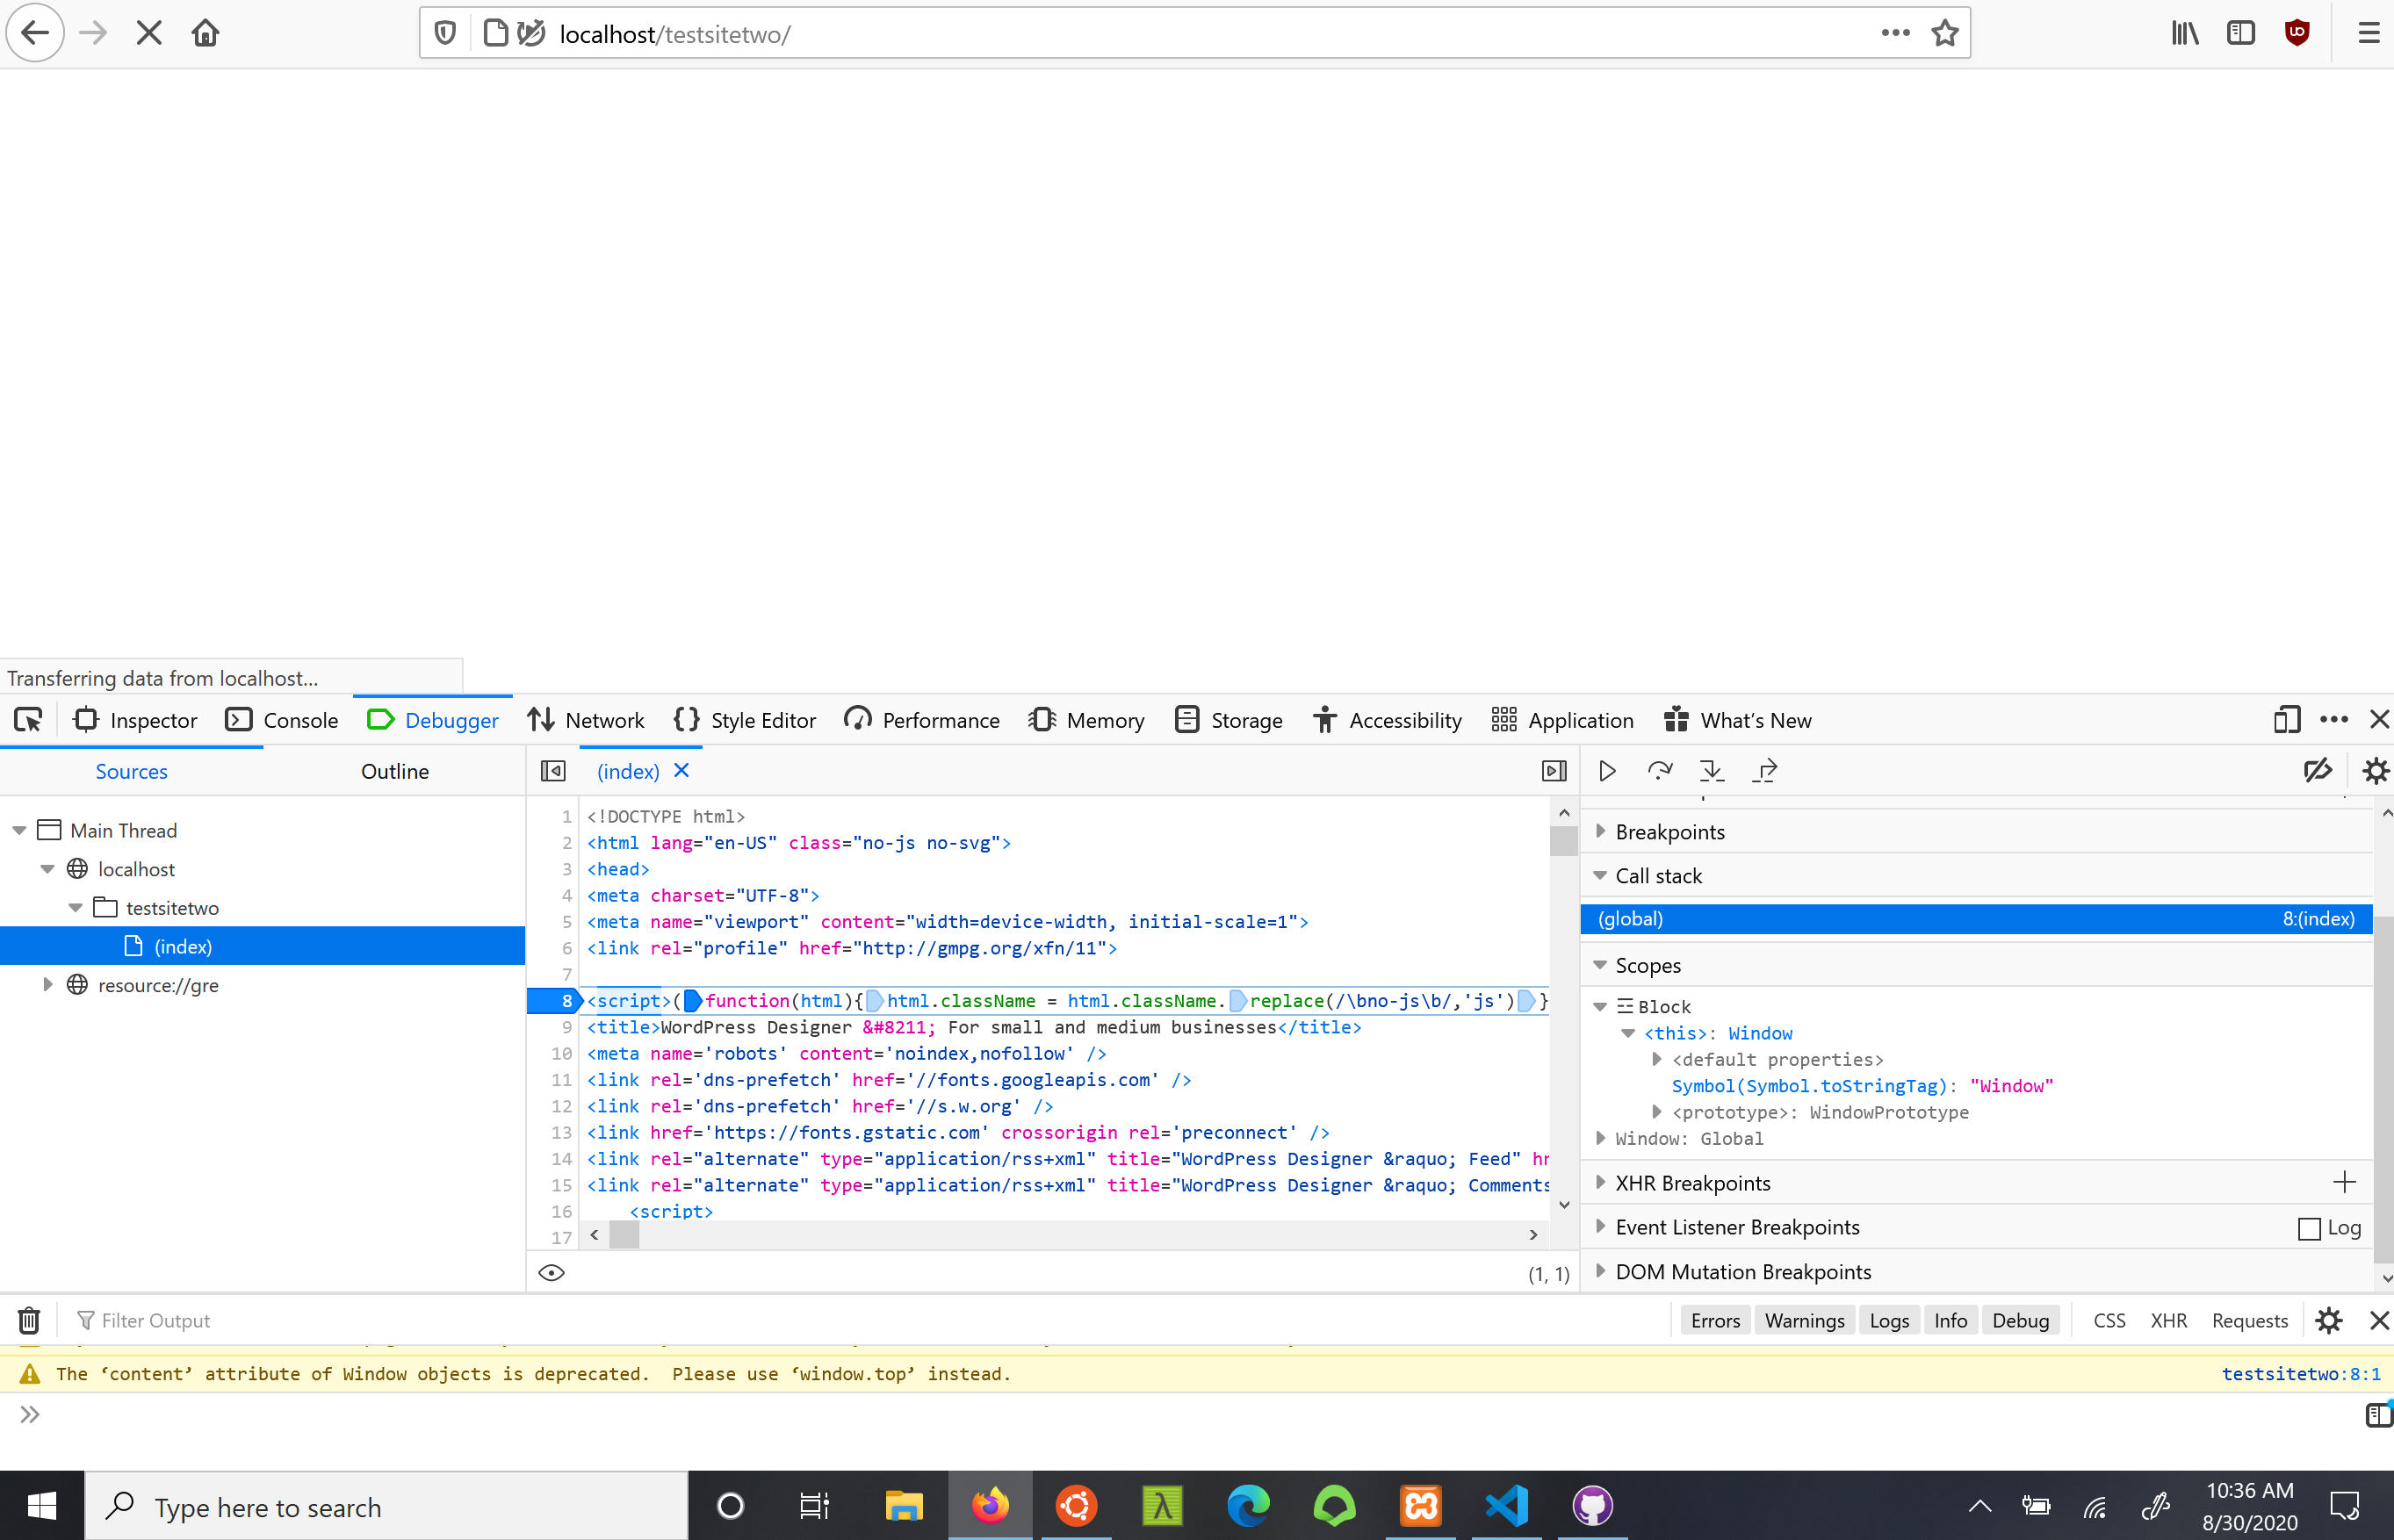
Depending on if you are debugging front end tasks or back end tasks, you should have some options to drill down to the object level and look at the program’s flow. When debugging you want to avoid guesses. Once again depending on your company, if you are using an Agile workflow this will help with your estimation technique.

Depending on your debugger, you will have many common options. Step-over, step-into, breakpoints, variable watching, and more. Step-over will just walk you through the level of execution you are on. You will walk top to the bottom of the file you are currently debugging. Step-into will take you into a calling method if you are over one. If there is nothing to step into you will default to a step over. Starting with this and expanding your tool belt to use the call stack to see the programs flow, or use the intermediate window in visual studio.

Comments powered by Disqus.